Showing posts with label Qliksense. Show all posts

Dynamic field change in Straight table - Qliksense

Below is the process to change the dimension dynamically in table in which all measures remains same.

Build a inline table with one field and give the field names as values for that field

Example inline table looks as below

Load * Inline
[
Dimension
Dimension1,
Dimension2,
Dimension3,
];


Use below expression in the dimension field for straight table

=IF(GetSelectedCount(Dimension)=1,
IF(Dimension='Dimension1',Dimension1,
IF(Dimension='Dimension2',Dimension2,
IF(Dimension='Dimension3',Dimension3,
))),Dimension1)

Use below expression in the straight table label to reflect label name dynamically whenever make a selection in the filter

=IF(GetSelectedCount(Dimension)=1,
IF(Dimension='Dimension1','Dimension1',
IF(Dimension='Dimension2','Dimension2',
IF(Dimension='Dimension3','Dimension3',
))),'Dimension1')

and also use the same above expression in the filter title to get title updated dynamically updated when selection is changed. Default section is 'Dimension1' in all the expressions


Below screen shot explains a filter where the dimension needs to be selected and will change automatically in the straight table


ODAG - On demand app generation in qliksense

Enables users to generate Qlik Sense applications on-demand i.e. after interactively selecting the data they are interested in discovering insights on.
Provides an ability to load and analyse data sources with large volumes of data in Qlik sense.
Loading entire volume of data from a larger data source is inefficient 
But to make representative analysis the entirety of the data should be accessible
On demand provides a solution for that provides users with a "shopping list" experience enables them to interactively populate their apps with a subset of data such as time period, customer segment, or geography.
                  ODAG – Configuration
On-demand app generation is controlled by the On-demand app service which is managed in the Qlik Management Console.
The service is disabled by default and must be enabled before selection and template apps can be linked and on-demand apps generated.
                    ODAG – Components
On Demand Selection App: Loads an aggregate view of the big data source with modest dimension granularity
On Demand Template App: its load script contains data binding expressions used to formulate the queries made on the data sources.
App Navigation links
Navigation bar – Each sheet in a selection app contains an app navigation bar
Navigation Point – Once a navigation link is dropped in an app’s sheet’s navigation bar it’s called a navigation point


New visualizations and features in Qliksense April 2018

                                             Waterfall Chart

Shows how the Initial Value is affected by Intermediate Positive and Negative Values
Whole Bars represents Initial and Final Values of Chart.
Floating/Hanging Bars represents Intermediate Positive and Negative Values

Example below shows how Initial Value Sales is impacted after Intermediate deductions of Expenses and Taxes are applied, and finally showing Net Income as Sub Total.


                    Distribution Plot Chart
To Show Range and Distribution of groups of numerical data
Data is plotted as Value points and Bounding box highlights the range of distribution.
Stretched box shows high distribution compared to Compressed box with low distribution.
Box color and point color can be changed accordingly.
Example below shows how Sales are distributed for each Sub Category (Represented as box stretch) and across each Quarter (Represented as Value points).


                         Histogram Chart
Shows distribution of numerical data over a continuous interval.
Data is organized into bins and height of bin represents frequency.
Grouping of data into bins can be customized by adjusting the Width of bars or Setting number of bars to display.
Below example shows temperature frequency of a Country in an year. (Bar Width set to 2 and so for every 2 degrees a bin is created).


                                Box Plot Chart
Provides Range and Distribution of Numeric Data
Components of Box Plot
Whiskers- Represents Reference value which is a Quartile, Percentile or Standard Dev based.
Box- Represents First and Third Quartile values with a Median Line.
Outliers- Represents data points falling outside the Whisker range.
Below example of box Plot Chart shows distribution of Sales by Month.

                    Maps visualizations 
Qlik Sense April 2018 features significant improvements to the built-in maps visualization
Support for multiple layers.
Labels for point layers and area layers
Quick look up of countries, divisions, cities,
     postal code areas
No fixed upper limit of number of objects,
     number of bubbles on area layer
Circle select with distance measure
Drill down support


Installing Qliksense


Once Prerequisites are completed, proceed to install the Qliksense latest version downloaded from Qlik.com. Please see below are the steps to download software

Open Qlik.com site on your browser. Below is the home page and click on login on Right side


Once clicked on login page, you will get this page


Please enter credentials and click on customer downloads on the page and you can see customer downloads and there select the options based on your requirement. to give example here, am selecting qliksense server April 2018 below. please find below image


Once software is downloaded, Place the qliksense software on server desktop and start installation

Please right click on software and run as administrator and then click on yes


once click on yes, you will get an option to Join cluster. Please find below image


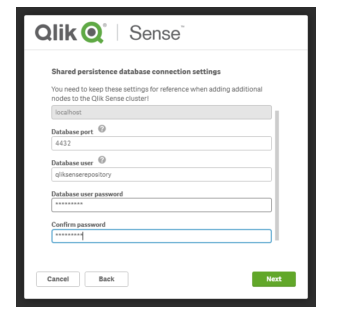
Once clicked on Join cluster, you will get an option to give database details. Please give user password and keep it safe for future use.Please find below image


As discussed in earlier post, for shared persistence we need a shared folder. whatever folder created as part of prerequisites, Please give that folder name starting with server name. This folder should be shared after creating by right clicking on the folder and share it to the Functional account. Please find below image


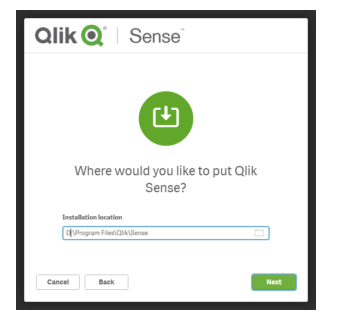
Please put default directory as C drive to put installation files. Please find below screen shot


Once this is done, it will ask for Functional account and please give those details


Once this is given, Installation run its on own and it will show as complete


Administering Qliksense

Administering Qliksense:

This contains information on how to deploy qliksense on single node.Before proceeding to install,consider the below prerequisites.

We have to set up a functional account to run qliksense services going to install on server. After creating the functional account,it needs to be added in the administrators group located in the computer management. Once it is added, the account  has complete access to the server. Please find below screen shot shows where functional account needs to be added


Earlier qilksense used to release the two types of installations synchronized and shared persistence. As there were some issues with synchronized persistence qliksense stopped releasing sync persistence from 3.2 version. Now we have only shared persistence installation type. Let me give a brief introduction on sync and shared persistence.(shared persistence has only database installed only on central node and it has shared by slave/rim nodes if there are any where as sync persistence has database installed on each node)


For shared persistence type, We need to create a shared folder to store repository files. This should be created on central node and should be shared. The path needs to be given in one place as part of installation. Will explain installation in the next post.


RARBG Shutdown: Unveiling the Surprising Closure and Implications for Torrent Users

In a surprising turn of events, renowned torrent website RARBG has announced its unexpected shutdown, leaving millions of users perplexed. T...